
Purpose
What the constraints protect against.
An options surface can look smooth while still implying impossible prices. The fit layer checks the SVI smile and the surface assembled across expiries before the UI treats it as a production-quality curve.
Smile checks
Butterfly arbitrage checks.
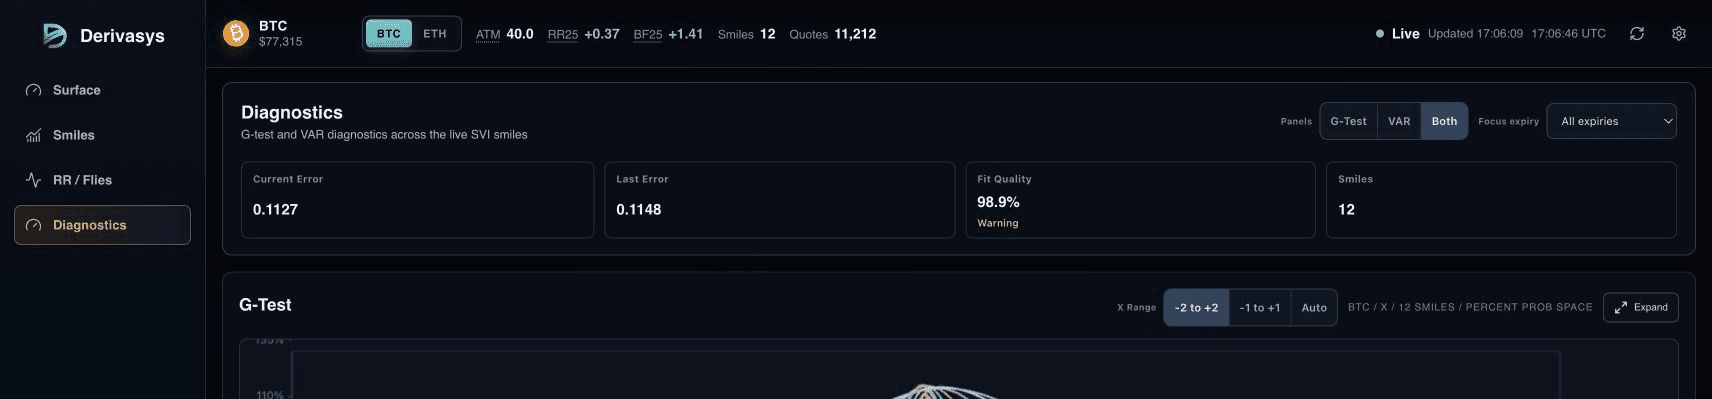
For each expiry, the fitted total variance smile should not imply a negative risk-neutral density. In practical terms, the engine evaluates the smile shape across a grid of log-moneyness points and publishes g-test diagnostics when local convexity or wing behavior becomes suspicious.
Term checks
Calendar arbitrage checks.
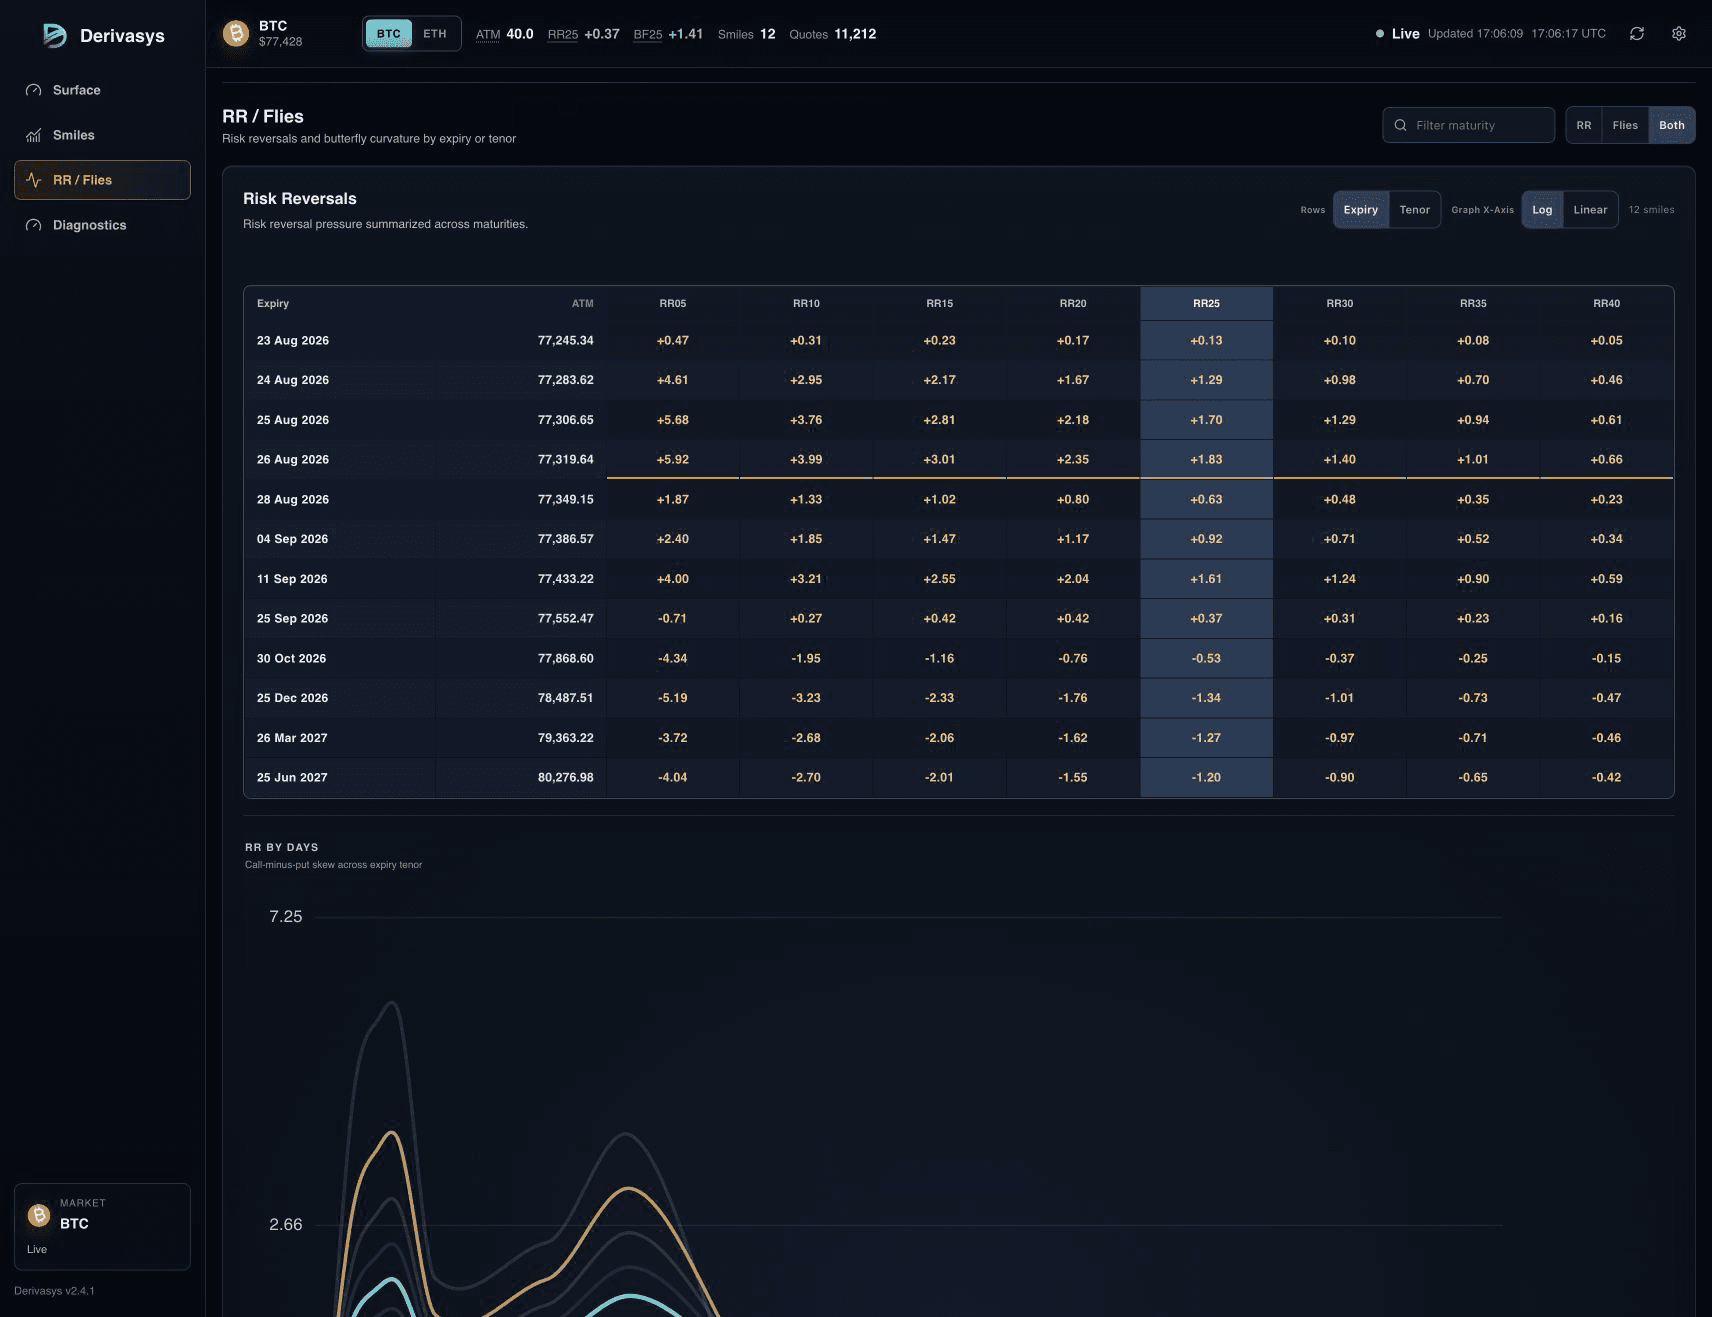
At the same moneyness, total variance should generally not fall as expiry increases. The surface grid and tenor rows make that check visible by comparing the fitted BTC smiles across maturities rather than only one expiry at a time.
Dashboard
What the Fit page shows.
The Fit tab exposes the fitted variance curve, fitted volatility curve, 3D surface projection, and g-test panel. If the g-test view spikes or the fit error deteriorates, it is a signal to inspect the market data, stale venue overlays, or calibration inputs before relying on the surface.
Native object
Variance lines and g-test diagnostics.
The variance view plots total implied variance by expiry rather than annualized implied volatility. SVI is calibrated in variance space, so these lines are the native fitted objects.
The g-test view is a diagnostic series published by the upstream engine for the fitted SVI smile. A stable line is expected for a usable fit; spikes or sign changes should be reviewed alongside stale quotes, crossed markets, and current fit error.
Access
API outputs for testing.
The same fit-quality state is available in request-based WebSocket evaluation for the seven verified live surfaces. REST behavior remains testing and is not presented as a stable open contract.