
Definition
What is a crypto options volatility surface?
Crypto option markets quote many strikes and expiries, but those quotes are discrete, noisy, and venue-specific. A volatility surface converts those market points into a continuous structure: implied volatility by strike, moneyness, and maturity.
In Derivasys, the fitted surface is built around SVI, a compact parameterisation commonly used to model the shape of an implied volatility smile. The dashboard then compares that model surface against live bid, ask, and last-trade implied volatility.
A static end-of-day surface is not enough for live crypto options monitoring. Traders and PMs need to see surface level, skew, convexity, venue disagreement, stale quotes, and fit health together.
Live dashboard
What the Derivasys dashboard shows.
- Live BTC, ETH, SOL, XRP, HYPE, AVAX and TRX options SVI variance and volatility curves.
- Per-expiry smile charts with fitted curves and quote clouds.
- Deribit and OKX bid, ask, and last-trade implied volatility overlays.
- Risk reversal and fly grids in expiry and tenor modes.
- Quote-through-fit matrix for bid and ask levels through SVI mid.
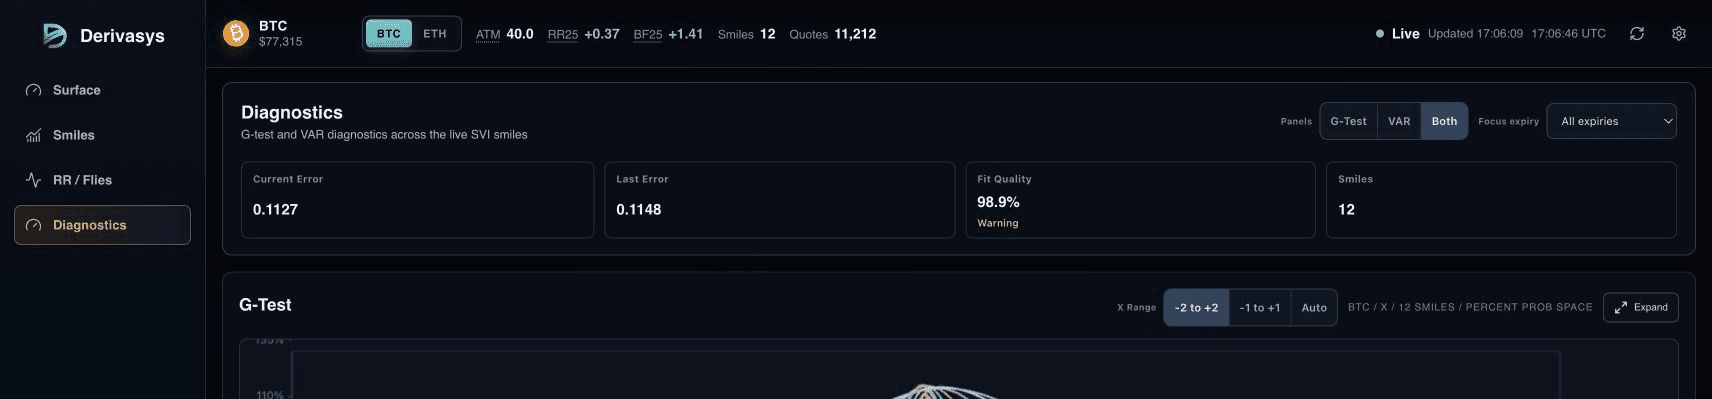
- Fit objective, elapsed calibration time, feed state, and update timestamps.
- Beta WebSocket evaluation by request; REST behavior remains testing under evaluator-specific terms.
- Fixed-tenor term-structure rows alongside native expiry views.
Access
API access for testing.
Beta WebSocket evaluation is available by request and follows the snapshot/patch contract used by the dashboard. REST behavior remains testing; endpoint names and resource availability are not asserted as a stable public contract.
BTC, ETH, SOL, XRP, HYPE, AVAX and TRX are verified live product currencies. Open the dashboard for current service state and asset-specific venue support.
Workflow
How to read the live surface.
Start with the header metrics to confirm the feed and calibration are live. Then use the risk reversal and fly grids to understand skew and curvature.
The smile matrix shows the raw market points around each fitted curve, while the quote-through-fit matrix highlights where bid or ask levels sit through the fitted mid.
FAQ
This site is the dashboard layer for a broader pricing and calibration workflow. It visualises live market data, fitted SVI surfaces, risk nodes, and operational diagnostics streamed from a backend API.
Yes. The dashboard monitors SVI-style fitted variance and volatility curves, then derives risk reversal, fly, and tenor analytics from the fitted surface.
The UI supports venue-specific quote overlays such as Deribit and OKX, allowing bid, ask, and last-trade implied volatility to be compared against the fitted surface.
Start with this page, then open the live dashboard and compare the fitted surface with the risk grids, smile matrix, and quote-through-fit overlays.