
Market structure
What an Ethereum options volatility surface shows.
An Ethereum options volatility surface maps ETH implied volatility across strike or moneyness and time to expiry. It connects individual ETH expiry smiles into a term structure that can be monitored consistently as spot, skew, and market expectations change.
Read the central implied-volatility level for each expiry and standard tenor.
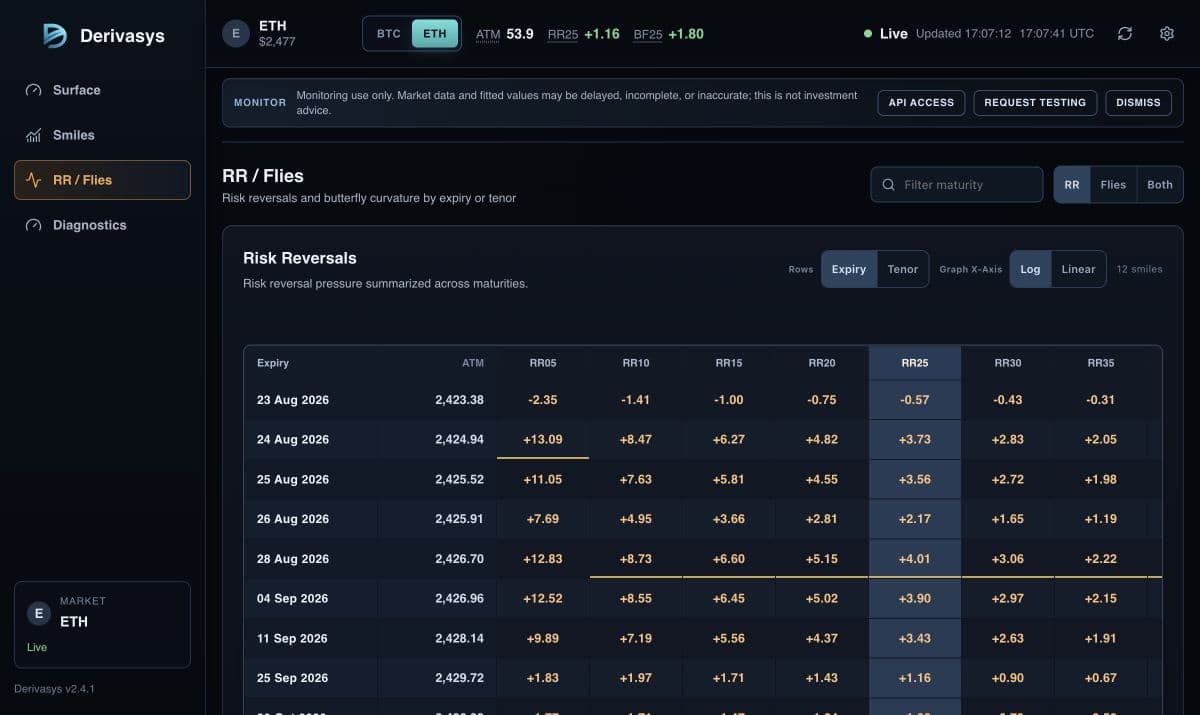
Track the relative volatility of 25-delta calls and puts across the Ethereum term structure.
Measure how rich the Ethereum smile wings are relative to ATM volatility.
Fit a smooth total-variance smile and inspect it against its live market inputs.
Live product
See more than a single Ethereum implied-volatility number.
- Inspect live Ethereum smiles across native expiries rather than relying on one composite IV measure.
- Compare fitted ETH volatility with supported-venue bid, ask, and trade-IV context.
- Monitor fixed tenors, RR25, and BF25 using the same definitions applied to BTC.
- Review freshness and fit diagnostics before using an apparent ETH volatility move as market evidence.
Cross-asset analysis
Compare ETH with BTC and SOL without collapsing their surfaces.
Seven live crypto options markets can share model conventions while expressing different surface levels, skews and maturity structures. Traders and risk teams can move between them with consistent definitions and asset-specific market state.
Use the dedicated Bitcoin, Solana and altcoin pages for asset-specific interpretation, or open the broader crypto surface page for the combined product workflow.
Access
Use the live dashboard or evaluate structured ETH surface data.
The public dashboard is the primary visual entry point for the live ETH surface. Request-based WebSocket evaluation can provide structured surface state; REST behavior remains testing under evaluator-specific terms.