Stage 1
Ingest and normalize market data.
Streaming option quotes arrive venue by venue with different conventions, quality levels, and update timing. The first stage is to align expiries, strikes, forwards, and quote provenance so that the calibration layer sees comparable data rather than raw venue noise.
- Capture bid, ask, and last-trade context separately.
- Normalize expiry and strike identifiers across venues.
- Track venue-level overlays such as Deribit and OKX.
- Preserve timestamps so stale levels can be diagnosed.
Stage 2
Build smile coordinates.
Once quotes are normalized, the system places them into smile coordinates using forward-aware strike context and log-moneyness. That creates the x-axis used by the fitted variance curves and the surface view.
Stage 3
Calibrate SVI on each expiry.
Each expiry is fit independently in variance space, typically with constraints designed to reduce unstable parameter jumps and prevent obviously unrealistic shapes.
- Fit a continuous variance smile from discrete market points.
- Stabilize skew and curvature relative to noisy quotes.
- Retain enough flexibility to follow genuine market moves.
Stage 4
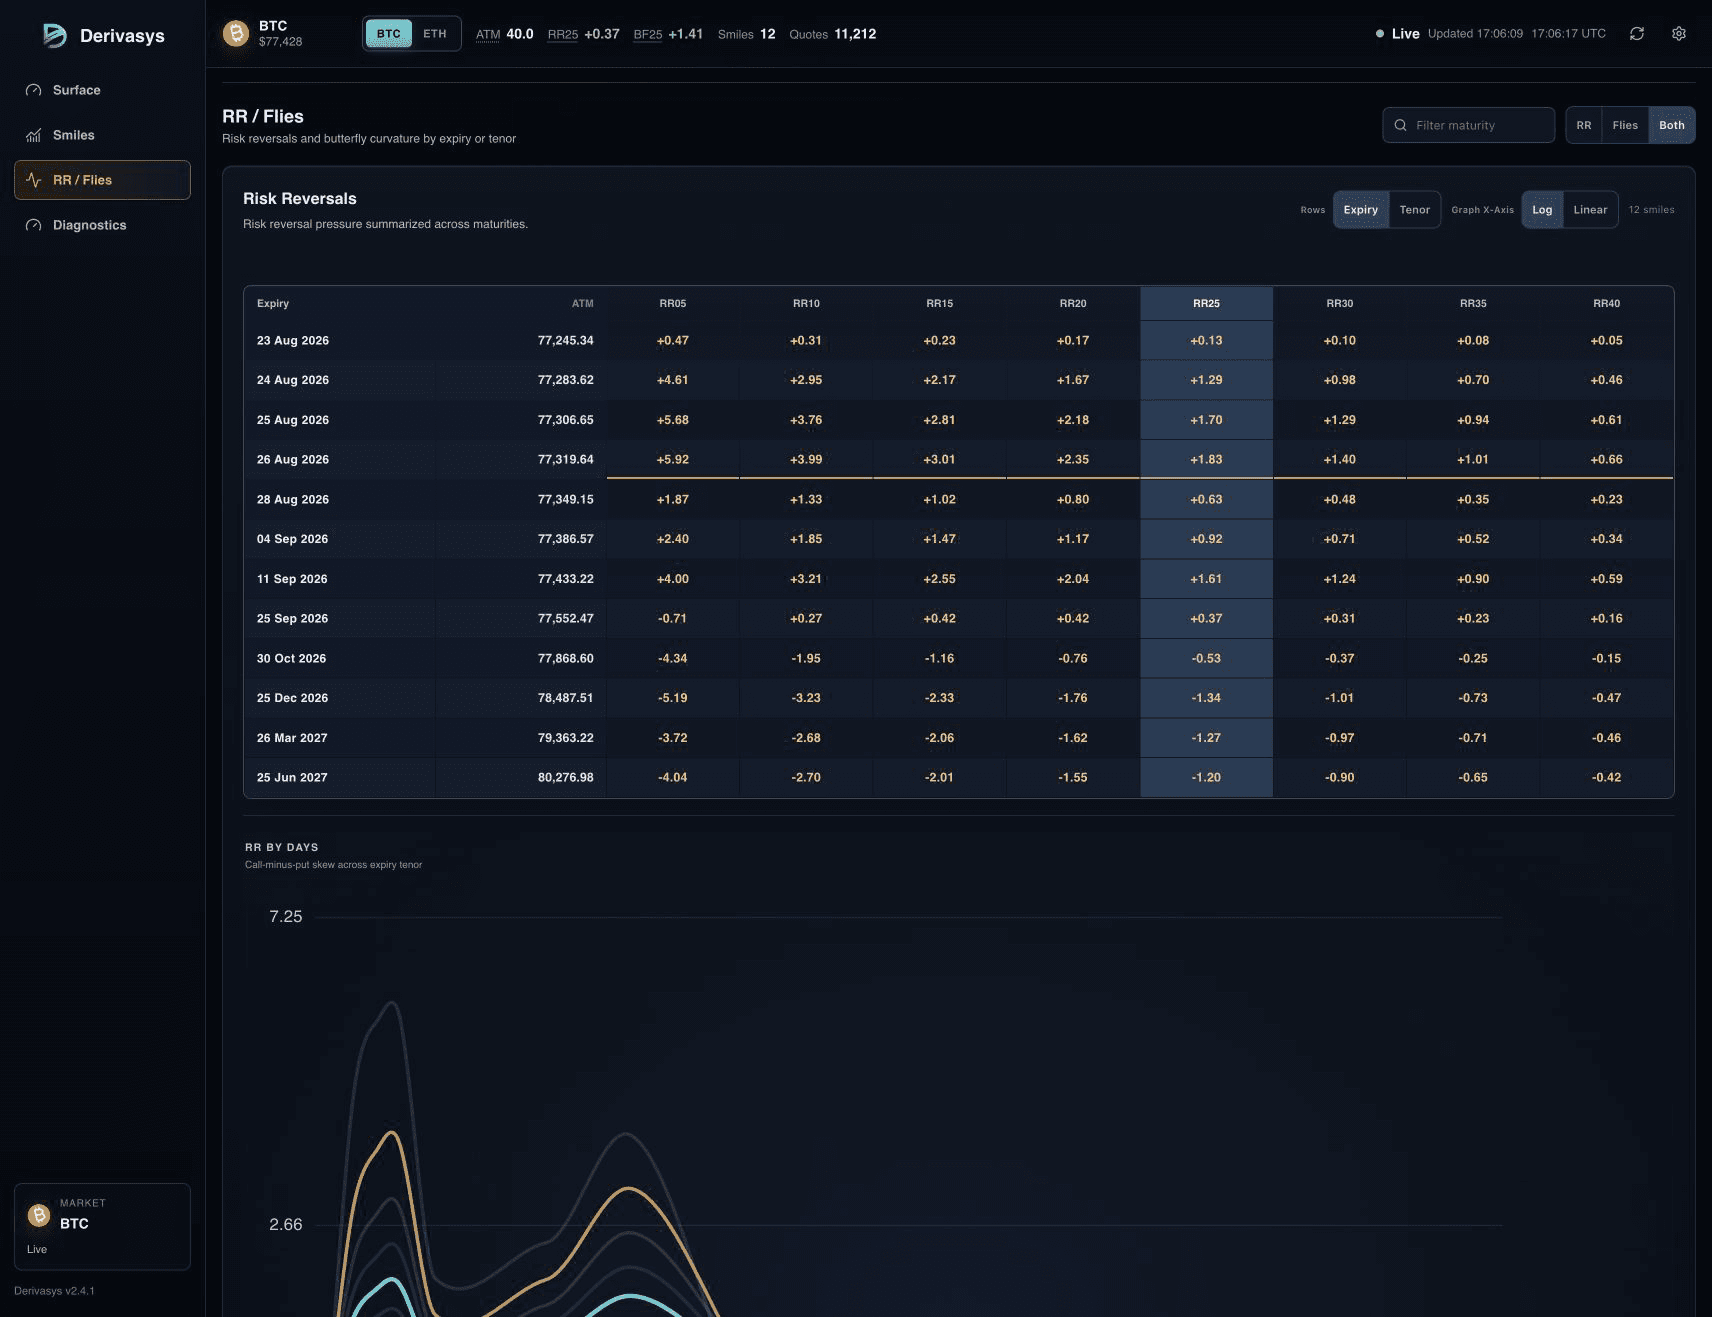
Derive risk nodes and tenor rows.
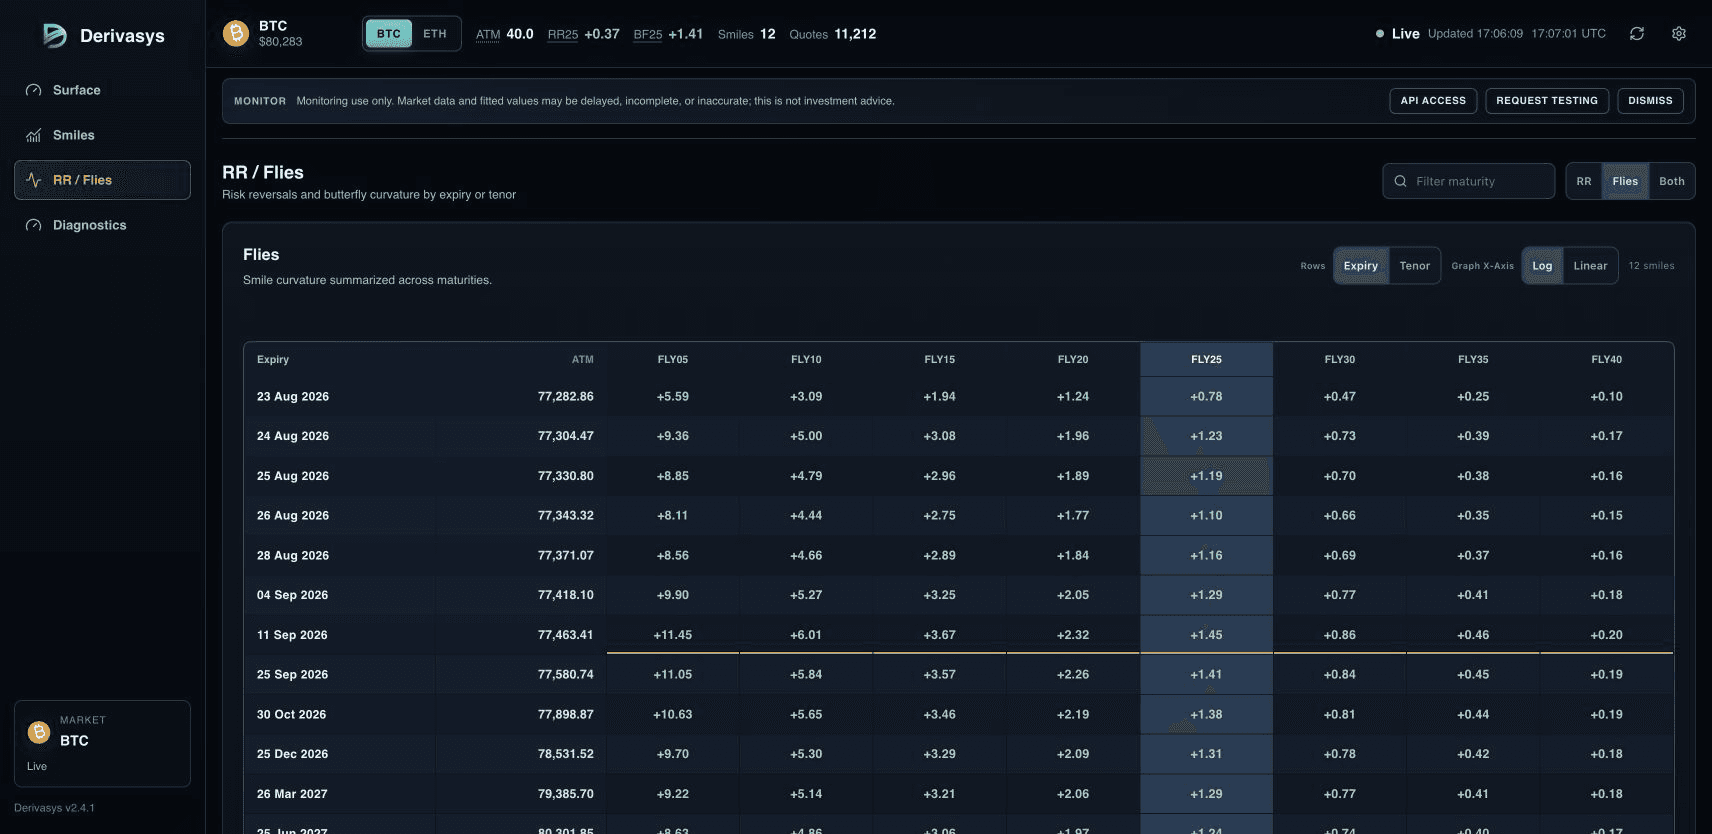
The fitted smile supports downstream analytics: ATM context, risk reversals, flies, smile node grids, tenor interpolation, and term-structure views. These derived measures are often easier for traders to monitor than raw fit parameters.
Stage 5
Publish snapshots, patches, and diagnostics.
The WebSocket contract broadcasts full snapshots for bootstrap and sparse patches for live updates. Candidate REST resources remain testing and are not named here as stable public endpoints.
- Surface snapshot for initial state.
- Surface patch for changed expiries.
- Smile levels by exchange and quote type.
- Tenor rows, RR/fly metrics, and fit-status messages.
- Evaluator-specific REST behavior under testing.