
System summary
The dashboard turns sparse options quotes into usable surface state.
Option markets are sparse and noisy: every expiry has many strikes, each venue has its own quotes, and the useful signal is often the difference between the market and a fitted surface.
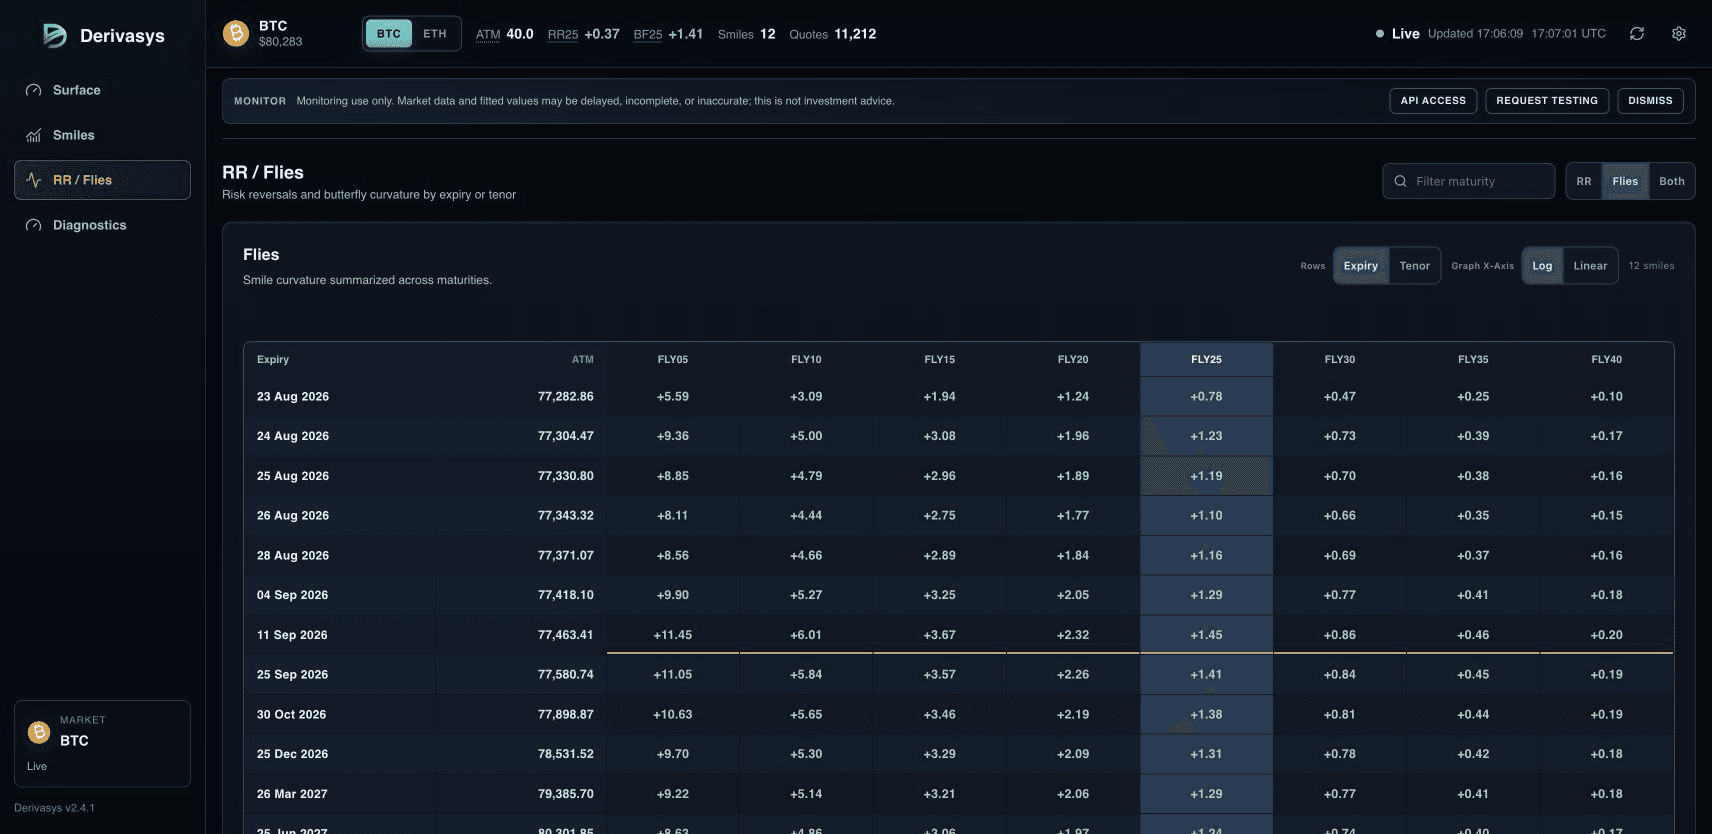
Derivasys ingests those updates, fits an SVI surface, and presents the live shape as variance, volatility, smiles, risk reversals, flies, and through-fit dislocations.
First checks
What to look at first.
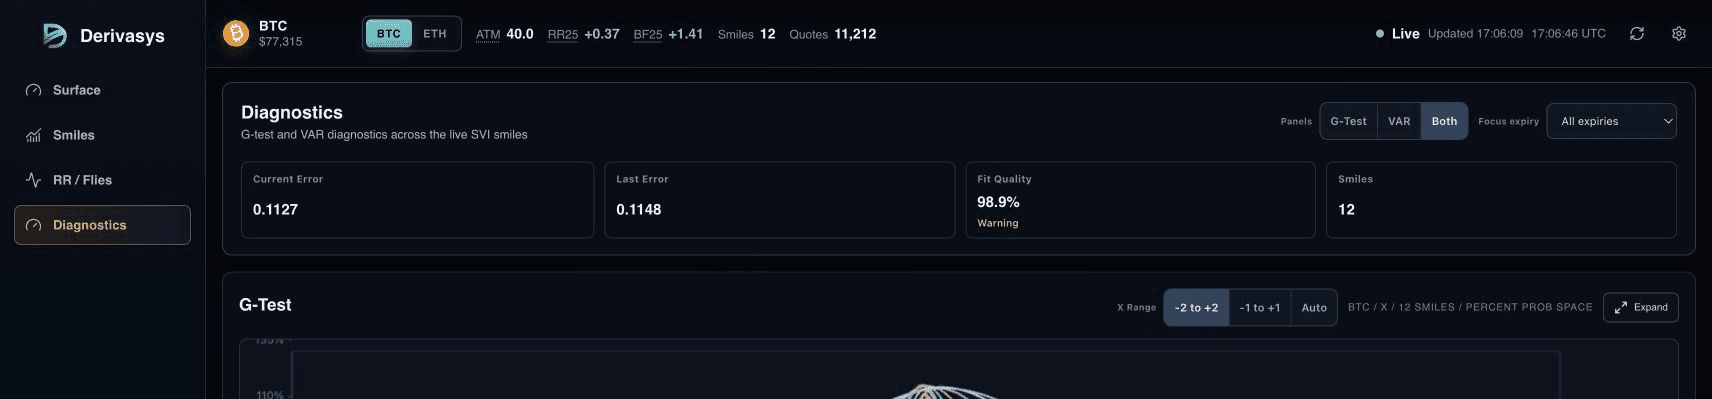
- Header metrics: feed state, fit objective, fit time, and latest SVI push show whether the engine is live.
- Risk reversal and fly grids summarize skew and curvature across maturities in trader language.
- SVI-through matrix shows where quoted bid or ask levels are through the fitted mid.
- Smile matrix compares the fitted curve with venue bid, ask, and last-trade implied vols.
- Fit tab exposes the surface and diagnostic views behind the market dashboard.
Use case
Why it matters.
A live volatility surface is the centre of many pricing-system problems. It supports quoting, risk generation, relative-value monitoring, venue comparison, and data-quality diagnosis.
The same ideas transfer beyond crypto options into rates curves, swaption surfaces, credit curves, and fixed income analytics.
This is not a trading ticket, investment advice, or a source of record. It is a monitoring interface for understanding a live pricing and calibration workflow.
Access
API availability.
The project exposes beta WebSocket evaluation by request using the dashboard snapshot/patch contract. REST behavior remains testing and is described only in the evaluator-specific contract.
BTC, ETH, SOL, XRP, HYPE, AVAX and TRX are the verified live currencies. Current venue and expiry support remain visible in the dashboard.